
6 | KPIs: the vital signs of your organization

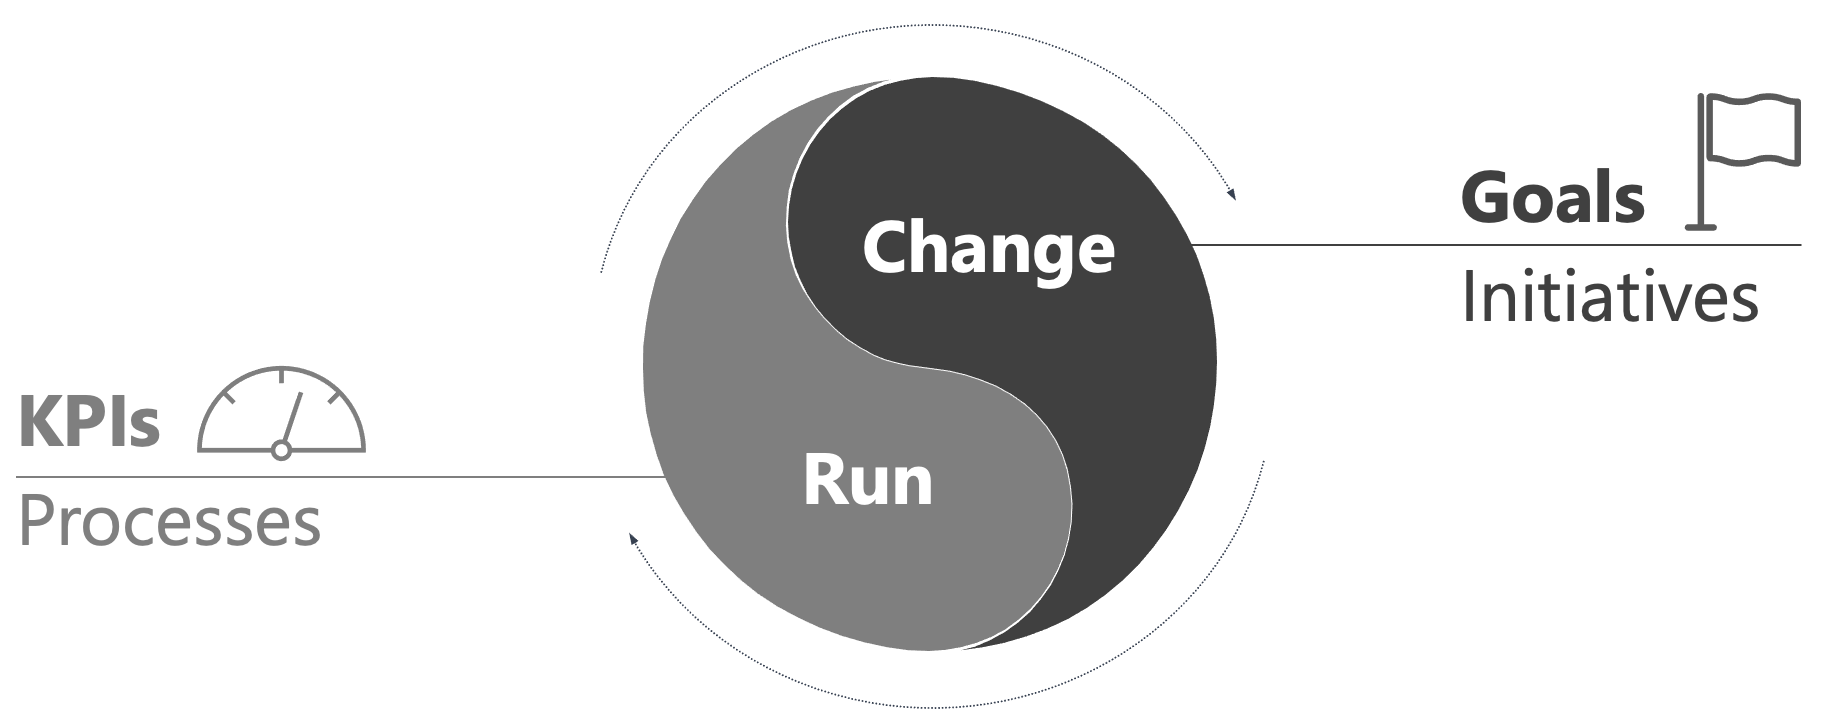
In a previous post, effective goals, we looked at how to drive change. But focusing on change alone is not enough. Whether you are managing your personal life, a small team, or a whole company, you are always dealing with two distinct states:
Run: the repeatable core of what you do, governed by processes – shipping orders, answering support tickets, deploying code. This is what continuously delivers value to customers and keeps the lights on.
Change: your efforts to improve or expand what you do, driven by initiatives – a product launch, a new market entry, an automation that saves time.
"Run" may sound like boring maintenance to some. That understates its value significantly. As Darrell Rigby argues in "doing agile right", "run" and "change" exist in a functional symbiosis.
Most customers do not buy your "change" directly, they buy your "run" – the reliability of your product, the quality of your service. Customers experience the outcome of "change" (shipping a new product), not the effort behind it (creating it). The purpose of "change", therefore, is to improve "run": an initiative that does not eventually make customers happier or operations better creates cost without creating value.
"Run" generates the revenue that funds "change", and surfaces opportunities for it: bottlenecks, complaints, places where customers could be happier.
Next to seeing value in both "run" and "change", it is also important to understand their opposite relationship with variance:
- In "run", variance is a liability. You want predictability until results are essentially identical every time. Variance here is bad – it means mistakes.
- In "change", variance is an asset. You experiment and learn from outliers to drive innovation. Variance here is good – it means new ideas.
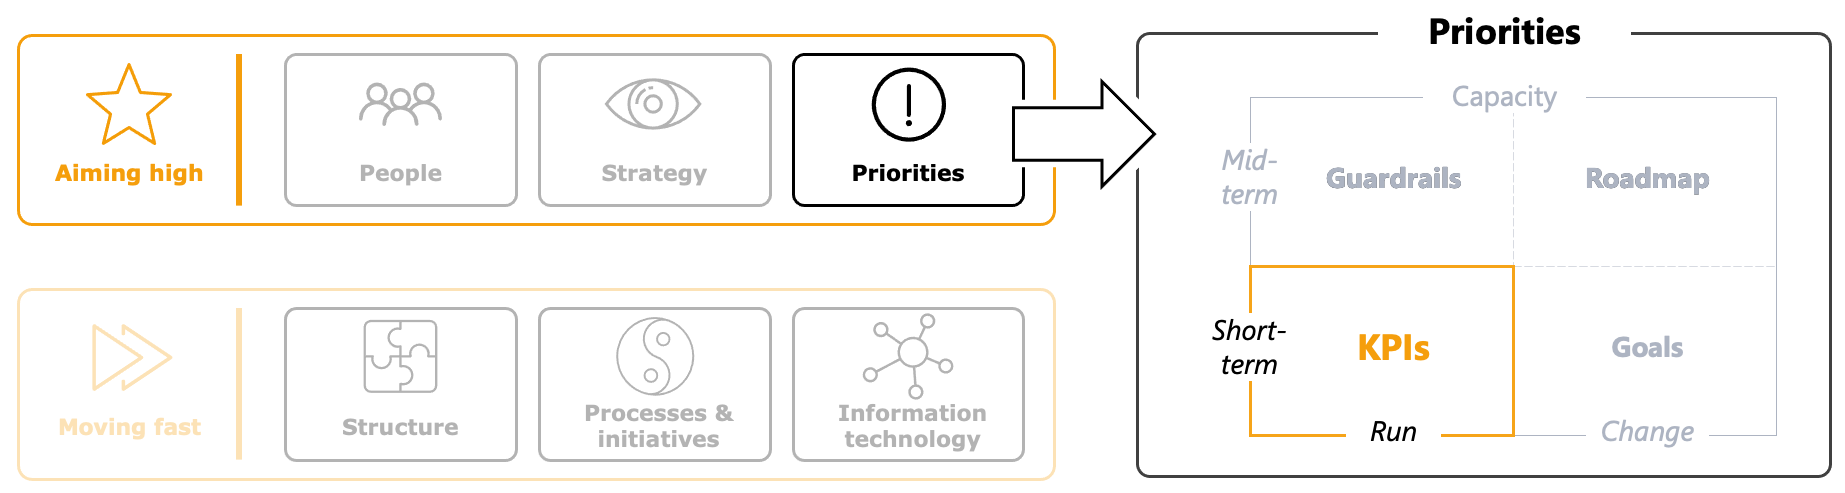
You cannot manage a creative experiment with the strictness of a factory line, nor run your payroll with the "fail fast" mindset of a startup. You need two different approaches, including two different tools: Goals to drive "change" and KPIs (Key Performance Indicators) to keep tabs on "run".
Creating a strong KPI system
A great KPI system does three things well. It creates focus on the right measures – the ones that actually reflect business health. It sustains a regular ritual – a rhythm where those measures are reviewed with discipline. And it drives corrective action when measures are off track – turning a red number into a decision and a fix.
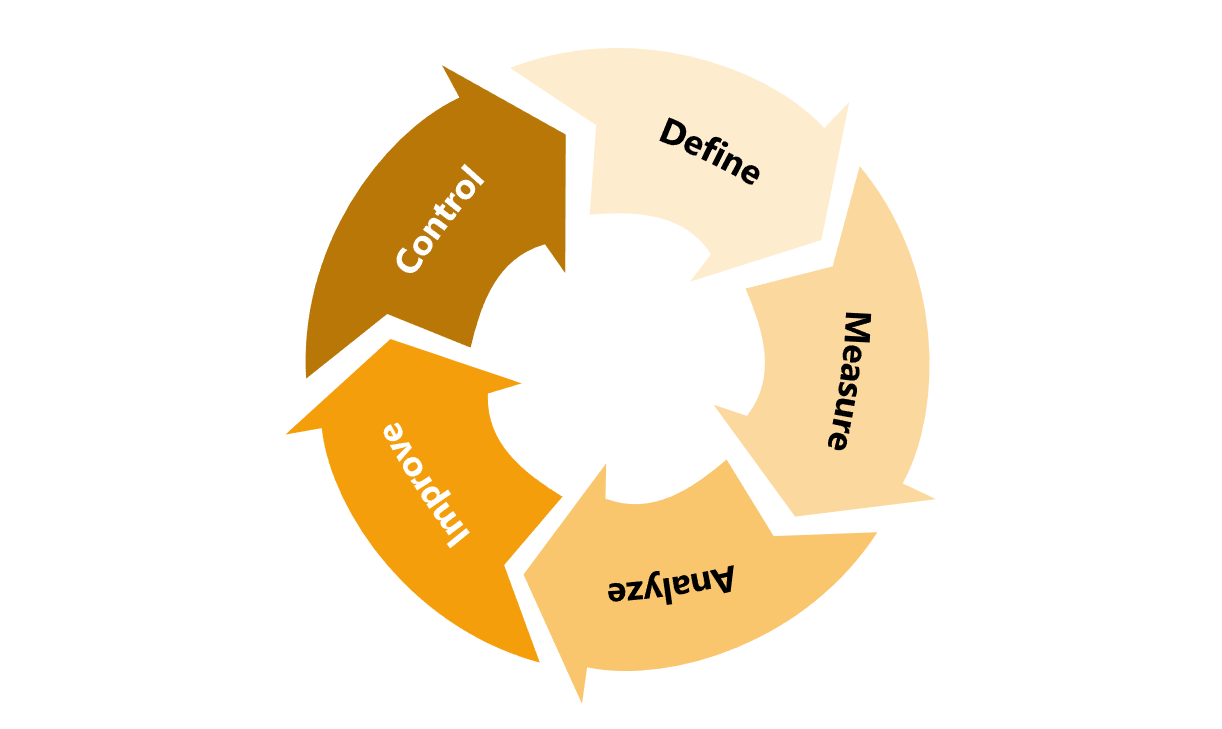
There is a method that can cover all three: DMAIC. It stands for Define, Measure, Analyze, Improve, Control. It originates in Six Sigma, where it is used as an approach to eliminate process variance. But the same five steps can also describe a complete steering system for the "run" part of an organization. Define becomes "decide what we measure and why". Measure becomes "build the data we will rely on to check org health". Analyze, Improve, and Control work the same at both altitudes – diagnose, fix, lock in – just applied across all metrics rather than to a single process.
In "working backwards", Colin Bryar and Bill Carr describe how this elegant adaptation of DMAIC is used at Amazon. Their "measures" chapter is worth reading in full and is the source I draw on most in my reasoning below.
Define: designing your KPI system
Think of KPIs as sensors for the health of your organization. They bridge the gap between abstract business results (revenue, EBITDA etc.) and daily operations. That is why Define is the most important of the DMAIC steps: measure the wrong things, and every subsequent step is wasted effort on a flawed foundation. To get Define right, three principles matter:
#1: Manage inputs, not outputs
As Colin Bryar and Bill Carr wrote: you cannot "do" a revenue number. Revenue and profit are outputs – the score at the end of the game. If you only track outputs, you have a reporting system, not a steering system.
Effective KPIs focus on controllable inputs: activities that, done well, produce the desired output. To find them, map your value stream and investigate where value stops flowing. If website traffic is high but sign-ups are low, the KPI to track is "sign-up conversion rate", not "total visitors".
Treat each input KPI as a hypothesis: "We believe that improving input X will lift output Y." If you improve X and Y does not move, you need to refine your hypothesis. That is not failure, it is learning. Expect this to happen. Finding the right input KPI is iterative, and the first version is probably not the right one yet.
#2: Pair metrics to prevent gaming
A single metric can create bad incentives. Andy Grove argued that every quantity measure should be paired with a quality measure to create a self-regulating system. Measure "deployment frequency", but also "change failure rate". Measure "sales call volume", but also "customer sentiment". The quality measure counters the incentive to game the quantity one.
#3: Clarify ownership and expectations
KPIs can enable decentralization and autonomy, but only when ownership and expectations are clear. Each KPI needs a single owner. If "the team" owns it, that typically means nobody does. The owner is not necessarily doing all the work, but they are accountable for driving corrections when needed. Ownership is a commitment to keep a "run" metric on track.
To make a KPI actionable, it needs a target. It defines the performance level required to deliver on the organization's overarching goals. Missing the target signals that current efforts will not be enough to deliver on what we promised.
Like with goals, I recommend avoiding the yellow trap: Some KPI systems create a yellow zone between "thresholds" and "targets". That can work, but it requires discipline. If yellow becomes the color of excuses (“not as we wanted, but…”), you are probably better off without it.
Measure: making data reliable and visible
Your data is likely scattered across CRMs, ERPs, ticketing tools, spreadsheets, and people's heads. Pulling it into one reliable place is cumbersome work, but flying blind is worse. Start small: one dashboard, the few most important KPIs, updated reliably.
Before you rely on any KPI, be clear about how it is measured. Which systems feed it, which filters are applied, which edge cases are excluded. If that is not crystal clear, your data will be unreliable. And that can be worse than having no data at all.
"Without data, you're just another person with an opinion." – W. Edwards Deming
Use the data in two ways: Have live data available on demand, so anyone can check the KPI when they need to. Even if you can only measure once a month initially, make that data point easy to access. Work toward higher frequency over time. You also should create snapshots of that data at defined points in time (e.g. month-end close) that you can use in reviews. This is important for creating accountability: THE fulfillment rate for March, THE newly awarded business for Q2.
Analyze: diagnosing, not explaining
When a KPI goes red, the question is not "why is this number down?" That invites explanation and defensiveness. The question is "what is the root cause, and how do we fix it?" This triggers diagnostic mode. Do not jump to Improve without Analyze first.
How you diagnose depends on the KPI, but it generally involves digging into data, talking to people closest to the process, and tracing problems back through their chain of causes. An effective technique for this is the "5 whys": Keep asking "why?" until you hit something structural rather than symptomatic. You could also unearth better input KPIs along the way. For larger issues, you may need a full process-improvement project – the DMAIC use case Six Sigma originally foresaw (a topic worth its own post).
Improve: getting corrective actions done
After identifying the root cause, define three things: The corrective action(s), an owner, and a deadline. The accountability part (who, by when) is important. The owner's job is not to solve the problem alone, but to make sure the corrective actions gets done.
A serious corrective action for "run" can become a "change" initiative in itself. If a fix needs its own resources and timeline, it graduates from "this week's corrective action" to "this quarter's goal."
Control: hard-coding what works
Once a fix works, lock it in. A corrective action that disappears once attention moves on is not a fix. For an improvement to stick, it needs to become part of a mechanism: a process simplification, an automation, or a process extension if needed.
Control is what converts a one-time improvement into a permanent lift in your "run" performance. Without it, the same red metric will return, the same diagnosis will be done again, the same corrective action will be launched. Skip Control often enough, and you get the feeling many organizations know well: that you are building on sand, with every improvement dissolving over time.
The rhythm powering your KPI system
A KPI system is only as good as the rhythm that sustains it. If you only look at your KPIs once a month, you are not steering – you are reviewing a report. Here my proposal for how to keep your KPI system in good shape:
Weekly: make tactical corrections. Each red KPI gets attention from its owner – root cause, corrective action, deadline. This is where most "DMAIC Improve" activities happen.
Monthly: zoom out. This is where you check on trends, target progress, and whether corrections are actually sticking.
Quarterly: refine the system. Which KPIs are still giving you early signal of org health? Especially in the early quarters, as you hunt for the right input metrics, this is where the KPI system evolves. If a KPI no longer triggers a decision or surfaces a problem, remove it. Focus on what matters.
Annually: realign with strategy. Ensure your KPIs evolve with your strategy. Strategic shifts – a new market, a new product line, a new customer segment – usually require an adjustment to KPIs as well.
See this as a blueprint that is adjustable to your organization's needs. High-velocity operations may review critical KPIs daily. Longer-cycle industries may run many KPIs only monthly. What matters is that the cadence is fast enough to catch problems while they are still correctable.
If you already run an operating rhythm similar to what I described in this post here, these touch points map cleanly onto it (weekly team meeting, monthly business review, quarterly alignment, annual outlook). Otherwise, start with the weekly check-in for tactical corrections, then add the rest as you grow into it.
Pitfalls to watch for
There are three issues that are likely to show up and therefore are worth highlighting.
#1 The update-only trap
Real outcome reviews are uncomfortable. The data is unambiguous, the gaps are visible, the owner has to stand behind a diagnosis and a fix. Many organizations respond to that discomfort by trying to cancel the meeting (usually framed as "this is bureaucracy" or "my time is better spent actually doing things"). When cancellation fails, the meeting often drifts into the second-best escape: a passive read-out of the numbers, with no challenges, no diagnoses, and no commitments.
In a healthy system, the owner comes to the review with corrective actions prepared. The review is where those commitments are discussed and confirmed. If senior leaders regularly have to step in and take decisions, the KPIs are not yet owned properly.
Outcome reviews are uncomfortable by design. That is the point. They are how teams build trust in each other by demonstrating follow-through.
#2 Blame culture around red KPIs
A red KPI should be treated like a high blood pressure reading at the doctor's office – a signal to investigate, not a failure to punish. When red becomes an occasion for blame, people stop surfacing problems. They modify the measure, negotiate lower targets, or quietly drop the reporting. The goal is to understand causes and drive fixes, not to find someone at fault. This is as much a leadership discipline as a system design question. The tone is set by whoever runs the review (and is hard to change once established).
#3 Noise obscuring the signal
Variation is normal. Not every movement in a KPI is meaningful. Learn to understand what normal looks like for each KPI so that actual exceptions really stand out. This takes time: you need to watch a metric long enough to develop a feel for its normal volatility. Statistical tools like control charts can help, but most of the intuition comes from experience.
Closing the loop
A strong KPI system is what keeps "run" healthy. "Run" is what delivers value to customers and funds "change". Get KPIs right, and you buy yourself the time and the focus to actually build.
This post was meant as an end-to-end view: Enough to start, but there is clearly more to KPIs. Data visualization, anomaly detection, root cause techniques. I will touch on these in future posts.
A final thought. Organizations that establish this way of working will not just produce better results, but also something more valuable: a track record of follow-through, and with it, trust. Trust in turn is what makes decentralized ownership work. This is the foundation of what I call earned autonomy. More on that next.
Further reading
- Working backwards by Colin Bryar & Bill Carr (specifically the "measures" chapter): The source I drew on most in this post and a great read on KPIs.
- Doing agile right by Darrell Rigby, Sarah Elk & Steve Berez: The source of the run/change framing at the post's start.
I value feedback. If you see something worth challenging or improving, feel free to reach out on LinkedIn. I treat these posts as living documents and will update them over time.